| Version 2 (modified by , 2 months ago) ( diff ) |
|---|
Advanced Reports
This page documents two complex analytical database reports for the Room Reservation System. The reports are written as SQL queries over the implemented PostgreSQL schema in the project schema. Each report uses several joined relations, grouping, aggregate calculations, conditional aggregation, derived indicators, and ranking in order to provide useful analytical information about the long-term operation of the reservation system.
The selected reports are:
- Quarterly room utilization and reservation status report
- Quarterly equipment demand and stock pressure report
Both reports are intended to support administrative decision-making. They can be used by a resource administrator or reservation approver to understand how rooms and equipment are used over time, which rooms are most frequently requested, and which equipment types may require additional stock.
Report 1: Quarterly room utilization and reservation status report
Data requirements idea / concept title
Quarterly room utilization and reservation status report
Data requirements description
This report analyzes how rooms are used during a selected year, grouped by quarter, building, and room. It calculates how many reservations were made for each room, how many of them were approved, rejected, cancelled, or still pending, and how many total hours were requested and approved.
The report is useful because it shows which rooms are used most often and which rooms may be underused. It also helps the organization identify whether certain buildings or room types have higher reservation demand. Since the report is grouped by quarter, it can be used for long-term analysis of room usage trends.
The report uses data from the following relations:
- project.reservations
- project.rooms
- project.buildings
The report performs the following operations:
- joins reservations with rooms and buildings;
- filters room-based reservations only;
- groups reservations by quarter, building, and room;
- counts total reservations;
- counts reservations by status using conditional aggregation;
- calculates requested and approved reservation hours;
- calculates each room's share of approved hours within the quarter;
- ranks rooms by utilization within each quarter.
Solution SQL
WITH room_reservation_base AS (
SELECT
date_trunc('quarter', res.reservation_date)::date AS quarter_start,
b.name AS building_name,
r.room_id,
r.room_code,
r.type,
r.capacity,
res.reservation_id,
res.status,
EXTRACT(EPOCH FROM (res.end_time - res.start_time)) / 3600.0 AS reservation_hours
FROM project.reservations res
JOIN project.rooms r
ON res.room_id = r.room_id
JOIN project.buildings b
ON r.building_id = b.building_id
WHERE res.room_id IS NOT NULL
AND res.reservation_date >= DATE '2026-01-01'
AND res.reservation_date < DATE '2027-01-01'
),
room_quarter_summary AS (
SELECT
quarter_start,
building_name,
room_id,
room_code,
type,
capacity,
COUNT(reservation_id) AS total_room_reservations,
COUNT(*) FILTER (WHERE status = 'approved') AS approved_reservations,
COUNT(*) FILTER (WHERE status = 'rejected') AS rejected_reservations,
COUNT(*) FILTER (WHERE status = 'cancelled') AS cancelled_reservations,
COUNT(*) FILTER (WHERE status = 'pending') AS pending_reservations,
ROUND(SUM(reservation_hours), 2) AS requested_hours,
ROUND(COALESCE(SUM(reservation_hours) FILTER (WHERE status = 'approved'), 0), 2) AS approved_hours
FROM room_reservation_base
GROUP BY
quarter_start,
building_name,
room_id,
room_code,
type,
capacity
),
room_quarter_ranked AS (
SELECT
quarter_start,
building_name,
room_code,
type,
capacity,
total_room_reservations,
approved_reservations,
rejected_reservations,
cancelled_reservations,
pending_reservations,
requested_hours,
approved_hours,
ROUND(
approved_hours / NULLIF(SUM(approved_hours) OVER (PARTITION BY quarter_start), 0) * 100,
2
) AS approved_hours_share_percent,
DENSE_RANK() OVER (
PARTITION BY quarter_start
ORDER BY approved_hours DESC, total_room_reservations DESC, room_code
) AS utilization_rank,
CASE
WHEN approved_hours >= 4 THEN 'high_usage'
WHEN approved_hours >= 2 THEN 'medium_usage'
WHEN approved_hours > 0 THEN 'low_usage'
ELSE 'no_approved_usage'
END AS utilization_level
FROM room_quarter_summary
)
SELECT
quarter_start,
building_name,
room_code,
type,
capacity,
total_room_reservations,
approved_reservations,
rejected_reservations,
cancelled_reservations,
pending_reservations,
requested_hours,
approved_hours,
approved_hours_share_percent,
utilization_rank,
utilization_level
FROM room_quarter_ranked
ORDER BY
quarter_start,
utilization_rank,
building_name,
room_code;
Solution Relational Algebra
The report can be represented using extended relational algebra because it uses grouping, aggregation, conditional aggregation, and ranking.
Let:
- RES = Reservations
- R = Rooms
- B = Buildings
First, select only room-based reservations in the selected period:
A =
σ room_id IS NOT NULL AND reservation_date >= '2026-01-01' AND reservation_date < '2027-01-01'
(RES)
Then join reservations with rooms and buildings:
B1 =
A ⨝ A.room_id = R.room_id R
B2 =
B1 ⨝ R.building_id = B.building_id B
Then group the result by quarter, building, room, room type, and capacity:
C =
γ quarter_start, building_name, room_id, room_code, type, capacity;
COUNT(reservation_id) → total_room_reservations,
COUNT(status = 'approved') → approved_reservations,
COUNT(status = 'rejected') → rejected_reservations,
COUNT(status = 'cancelled') → cancelled_reservations,
COUNT(status = 'pending') → pending_reservations,
SUM(end_time - start_time) → requested_hours,
SUM(end_time - start_time WHERE status = 'approved') → approved_hours
(B2)
Finally, extended relational algebra is used to calculate the percentage share of approved hours and the utilization rank for each room inside the same quarter:
Result =
ρ approved_hours_share_percent, utilization_rank, utilization_level
(C)
This corresponds to the SQL query where window functions and CASE expressions are used for ranking and classification.
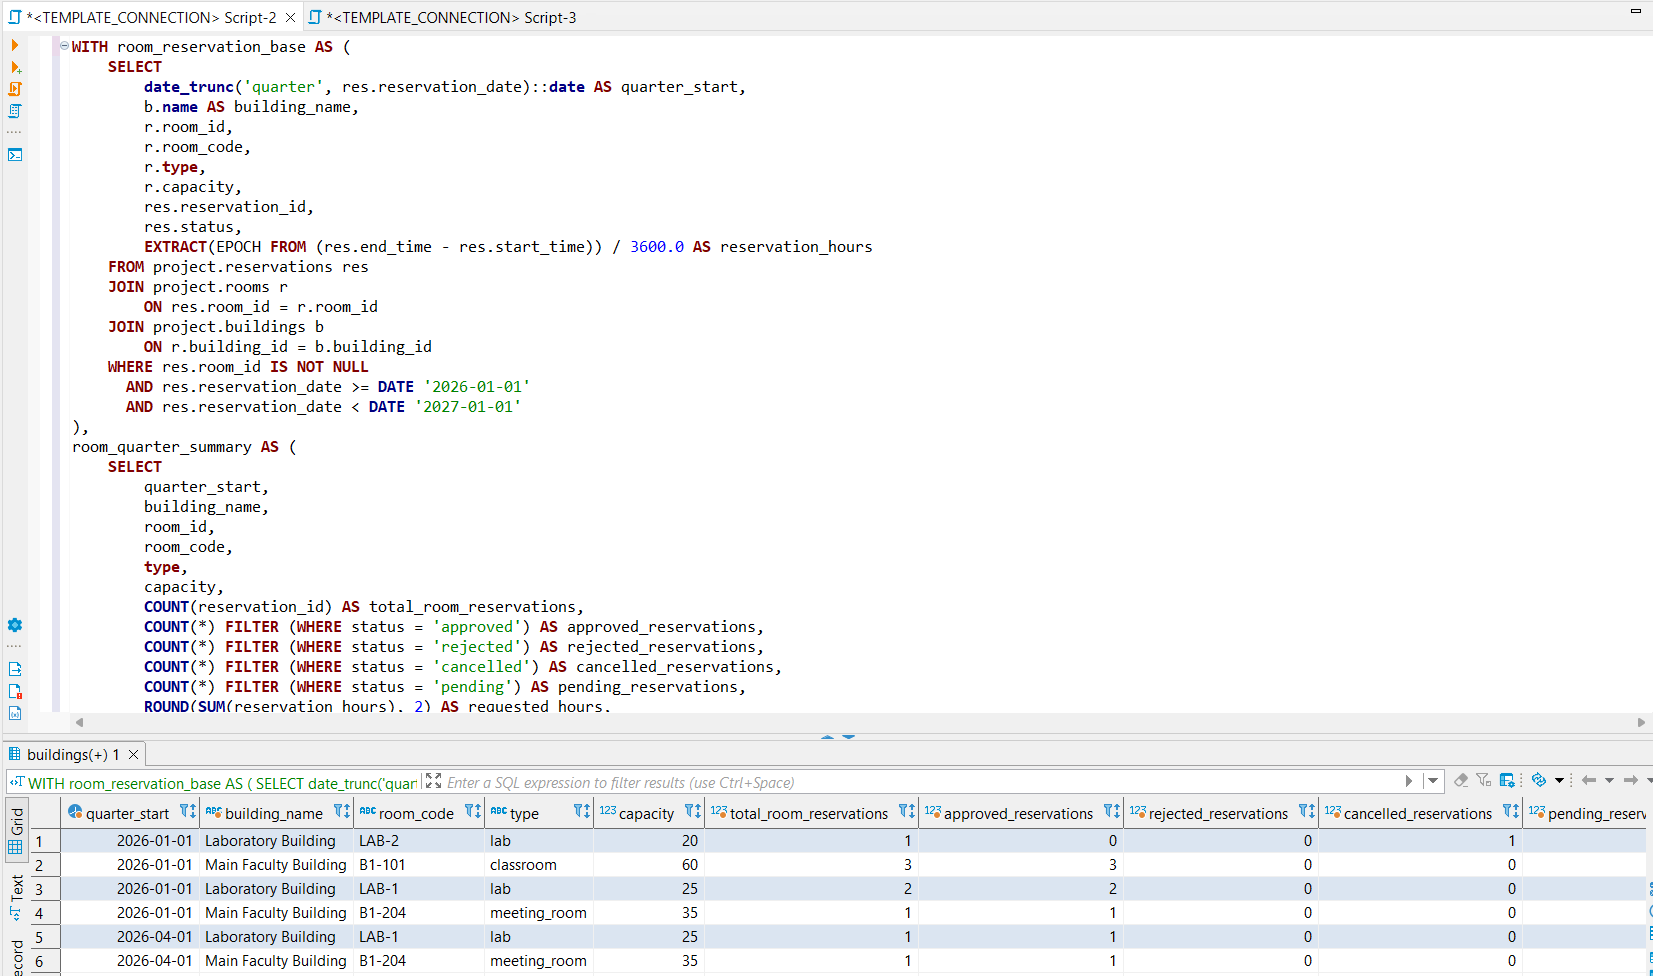
Report result screenshot
The following screenshot shows the result of executing the first report in DBeaver.

Figure 1. Quarterly room utilization report showing room reservations grouped by quarter, building, room, room type, capacity, reservation status, requested hours, and utilization ranking.
Discussion
The first report shows how each room is used during each quarter. The result includes the number of reservations, the number of approved, rejected, cancelled, and pending reservations, and the number of requested and approved reservation hours.
This report is useful for identifying rooms with high demand and rooms that are rarely used. If a room has a high utilization rank and many approved hours, the organization may consider increasing availability of similar rooms or assigning more equipment to that room type. If a room has very low usage, the organization may investigate whether its capacity, type, location, or equipment availability is not suitable for users.
Report 2: Quarterly equipment demand and stock pressure report
Data requirements idea / concept title
Quarterly equipment demand and stock pressure report
Data requirements description
This report analyzes equipment demand during a selected year, grouped by quarter and equipment type. It compares the number of requested equipment items with the registered stock quantity and the equipment assigned to rooms. It also calculates how much demand was approved, pending, or rejected.
The report is useful because it helps the organization understand which equipment types are requested most often and whether the existing stock is sufficient. It can support decisions about purchasing new equipment, moving equipment between rooms, or increasing the stock of frequently requested equipment.
The report uses data from the following relations:
- project.equipment
- project.room_equipment
- project.reservation_equipment
- project.reservations
The report performs the following operations:
- calculates how much equipment is assigned to rooms;
- joins requested equipment with reservations and equipment data;
- groups equipment demand by quarter and equipment type;
- calculates total requested quantity;
- calculates approved, pending, rejected, and cancelled requested quantities;
- compares demand with total registered quantity;
- calculates demand ratio;
- compares demand with the previous quarter;
- ranks equipment by demand in each quarter;
- classifies demand level as critical, high, medium, or low.
Solution SQL
WITH room_stock AS (
SELECT
re.equipment_id,
SUM(re.quantity) AS assigned_room_quantity
FROM project.room_equipment re
GROUP BY re.equipment_id
),
equipment_demand AS (
SELECT
date_trunc('quarter', res.reservation_date)::date AS quarter_start,
e.equipment_id,
e.name AS equipment_name,
e.stock_quantity,
COALESCE(rs.assigned_room_quantity, 0) AS assigned_room_quantity,
e.stock_quantity + COALESCE(rs.assigned_room_quantity, 0) AS total_registered_quantity,
COUNT(DISTINCT res.reservation_id) AS reservations_with_equipment,
SUM(req.requested_quantity) AS total_requested_quantity,
COALESCE(SUM(req.requested_quantity) FILTER (WHERE res.status = 'approved'), 0) AS approved_requested_quantity,
COALESCE(SUM(req.requested_quantity) FILTER (WHERE res.status = 'pending'), 0) AS pending_requested_quantity,
COALESCE(SUM(req.requested_quantity) FILTER (WHERE res.status = 'rejected'), 0) AS rejected_requested_quantity,
COALESCE(SUM(req.requested_quantity) FILTER (WHERE res.status = 'cancelled'), 0) AS cancelled_requested_quantity
FROM project.reservation_equipment req
JOIN project.reservations res
ON req.reservation_id = res.reservation_id
JOIN project.equipment e
ON req.equipment_id = e.equipment_id
LEFT JOIN room_stock rs
ON e.equipment_id = rs.equipment_id
WHERE res.reservation_date >= DATE '2026-01-01'
AND res.reservation_date < DATE '2027-01-01'
GROUP BY
date_trunc('quarter', res.reservation_date)::date,
e.equipment_id,
e.name,
e.stock_quantity,
rs.assigned_room_quantity
),
equipment_with_previous_quarter AS (
SELECT
quarter_start,
equipment_id,
equipment_name,
stock_quantity,
assigned_room_quantity,
total_registered_quantity,
reservations_with_equipment,
total_requested_quantity,
approved_requested_quantity,
pending_requested_quantity,
rejected_requested_quantity,
cancelled_requested_quantity,
LAG(total_requested_quantity) OVER (
PARTITION BY equipment_id
ORDER BY quarter_start
) AS previous_quarter_requested_quantity
FROM equipment_demand
),
equipment_ranked AS (
SELECT
quarter_start,
equipment_name,
stock_quantity,
assigned_room_quantity,
total_registered_quantity,
reservations_with_equipment,
total_requested_quantity,
approved_requested_quantity,
pending_requested_quantity,
rejected_requested_quantity,
cancelled_requested_quantity,
COALESCE(previous_quarter_requested_quantity, 0) AS previous_quarter_requested_quantity,
total_requested_quantity - COALESCE(previous_quarter_requested_quantity, 0) AS request_change_from_previous_quarter,
ROUND(
total_requested_quantity::numeric / NULLIF(total_registered_quantity, 0),
2
) AS demand_ratio,
DENSE_RANK() OVER (
PARTITION BY quarter_start
ORDER BY total_requested_quantity DESC, equipment_name
) AS demand_rank,
CASE
WHEN total_requested_quantity > total_registered_quantity THEN 'critical_demand'
WHEN total_requested_quantity >= total_registered_quantity * 0.75 THEN 'high_demand'
WHEN total_requested_quantity >= total_registered_quantity * 0.40 THEN 'medium_demand'
ELSE 'low_demand'
END AS demand_level
FROM equipment_with_previous_quarter
)
SELECT
quarter_start,
equipment_name,
stock_quantity,
assigned_room_quantity,
total_registered_quantity,
reservations_with_equipment,
total_requested_quantity,
approved_requested_quantity,
pending_requested_quantity,
rejected_requested_quantity,
cancelled_requested_quantity,
previous_quarter_requested_quantity,
request_change_from_previous_quarter,
demand_ratio,
demand_rank,
demand_level
FROM equipment_ranked
ORDER BY
quarter_start,
demand_rank,
equipment_name;
Solution Relational Algebra
The second report also uses extended relational algebra because it includes grouping, aggregation, left join, derived values, ranking, and comparison with previous quarter demand.
Let:
- E = Equipment
- RE = RoomEquipment
- REQ = ReservationEquipment
- RES = Reservations
First, calculate the quantity of equipment assigned to rooms:
RS =
γ equipment_id;
SUM(quantity) → assigned_room_quantity
(RE)
Then join reservation equipment with reservations and equipment:
A =
REQ ⨝ REQ.reservation_id = RES.reservation_id RES
B =
A ⨝ REQ.equipment_id = E.equipment_id E
Then add the equipment quantity assigned to rooms using a left outer join:
C =
B ⟕ E.equipment_id = RS.equipment_id RS
Then select only reservations in the selected year:
D =
σ reservation_date >= '2026-01-01' AND reservation_date < '2027-01-01'
(C)
Then group the result by quarter and equipment type:
E1 =
γ quarter_start, equipment_id, equipment_name, stock_quantity, assigned_room_quantity;
COUNT(DISTINCT reservation_id) → reservations_with_equipment,
SUM(requested_quantity) → total_requested_quantity,
SUM(requested_quantity WHERE status = 'approved') → approved_requested_quantity,
SUM(requested_quantity WHERE status = 'pending') → pending_requested_quantity,
SUM(requested_quantity WHERE status = 'rejected') → rejected_requested_quantity,
SUM(requested_quantity WHERE status = 'cancelled') → cancelled_requested_quantity
(D)
Finally, extended relational algebra is used to calculate:
- total registered quantity;
- demand ratio;
- previous quarter demand;
- demand change;
- demand rank;
- demand level classification.
Result =
ρ total_registered_quantity, demand_ratio, previous_quarter_requested_quantity,
request_change_from_previous_quarter, demand_rank, demand_level
(E1)
This corresponds to the SQL query where window functions, arithmetic expressions, and CASE expressions are used.
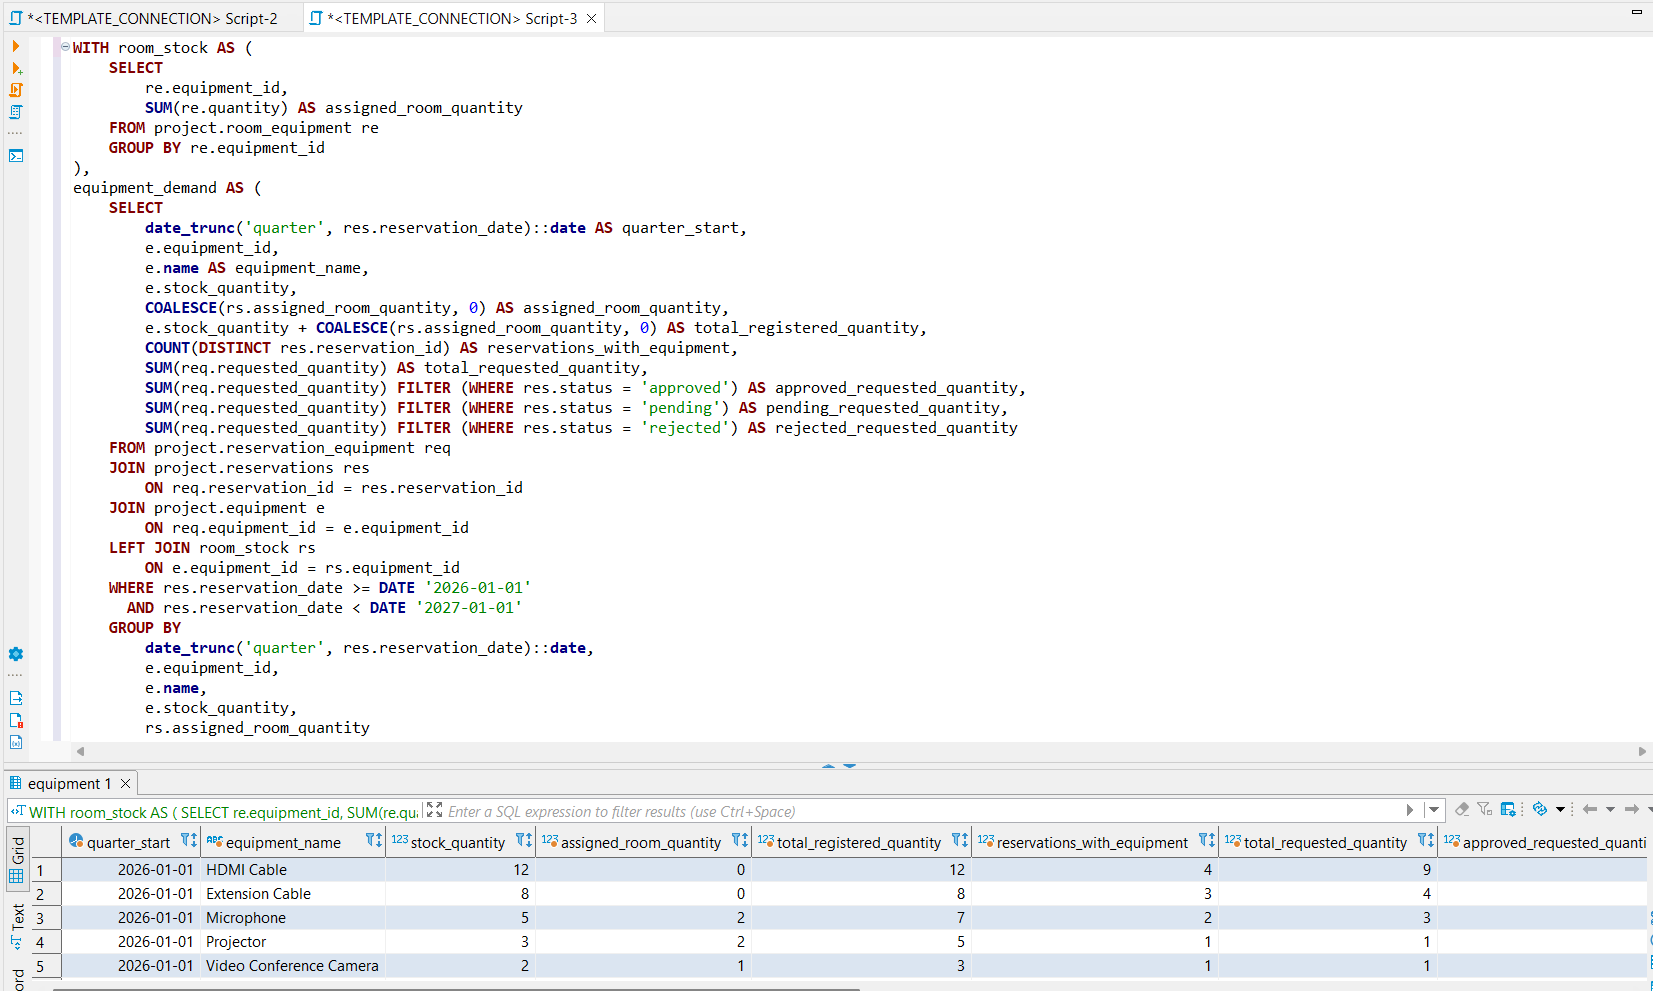
Report result screenshot
The following screenshot shows the result of executing the second report in DBeaver.

Figure 2. Quarterly equipment demand report showing requested equipment quantities, registered stock, approved, pending, rejected demand, demand ratio, previous quarter comparison, and demand level assessment.
Discussion
The second report shows how often each equipment type is requested and compares the requested quantity with the equipment registered in the system. This is useful for identifying equipment that is requested more often than expected.
For example, if an equipment item has a high demand ratio or a critical demand level, the organization may need to purchase more units, assign more units to rooms, or manage equipment availability more carefully. If an equipment item has low demand, the organization may decide that the existing stock is sufficient.
The report also includes a comparison with the previous quarter. This allows administrators to identify whether equipment demand is increasing or decreasing over time.
Final discussion
The two reports provide analytical information that is not directly visible from individual reservation records. The first report focuses on room utilization and reservation status, while the second report focuses on equipment demand and stock pressure.
The reports are more complex than the basic SQL queries used in previous phases because they use:
- multiple joined tables;
- common table expressions;
- aggregate functions;
- conditional aggregation with FILTER;
- date-based grouping by quarter;
- calculated indicators;
- window functions;
- ranking;
- CASE-based classification.
These reports can later be integrated into the prototype or into a future application interface as administrative reports. They support better planning of room capacity, equipment availability, and long-term resource management.
Attachments (2)
- report1_room_utilization.png (84.1 KB ) - added by 2 months ago.
- report2_equipment_demand.png (88.3 KB ) - added by 2 months ago.
Download all attachments as: .zip