Use Case Diagram
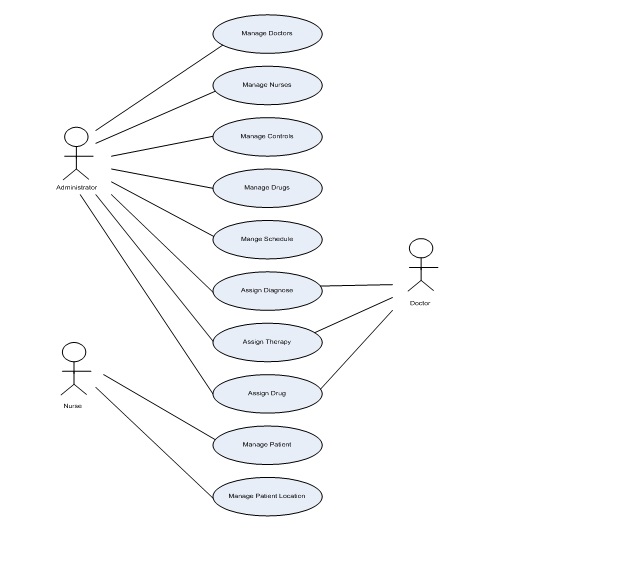
A use case diagram represents a set of use cases and actors and their relationships.
The main actors that are involved in the first use case diagram are: administrator, doctor and nurse. Every actor is related to a certain number of use cases. Every use case represents the tasks that should be performed within the application by a certain actor. In figure 1 the actor Administrator is in relation with the same use cases that is the actor Doctor, this is done because the administrator at the same time can work as a doctor in a given health center.

Figure 1 Use Case Diagram.
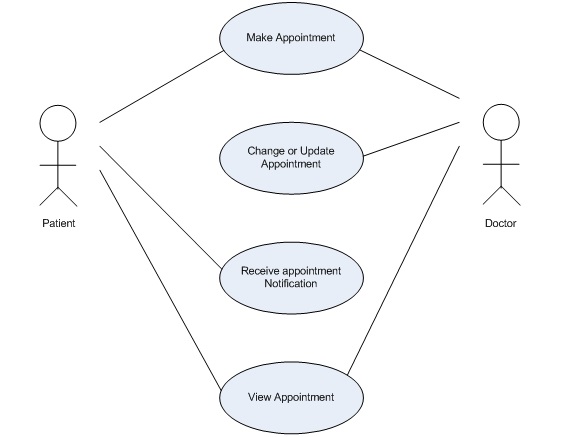
The use case diagram that is in the Figure 2 represent 2 main actors with 4 use cases. Here is described the tasks that the actors Doctor and Patient perform for making an appointment.

Figure 2 Appointment Use case Diagram.
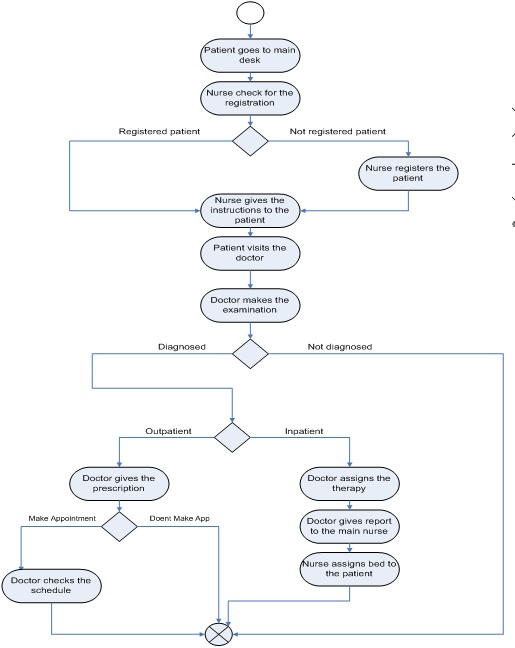
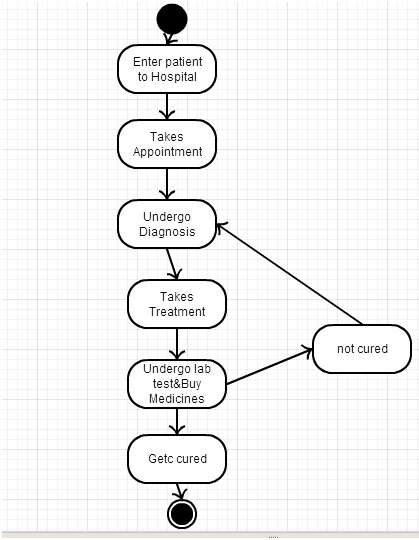
Activity Diagram
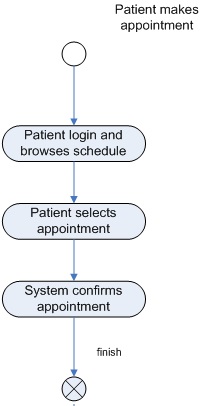
The activity diagram addresses a dynamic view of the system, it also emphasizes the flow of objects and synchronization of the flow in support of parallel processing. Here are presented two activity diagrams the first one is the main activity diagram which represents the most important activities of the system, and the second one is the schedule-appointment activity diagram.

Figure 3 Activity Diagram .

Figure 4 Schedule-Appointment Activity Diagram.
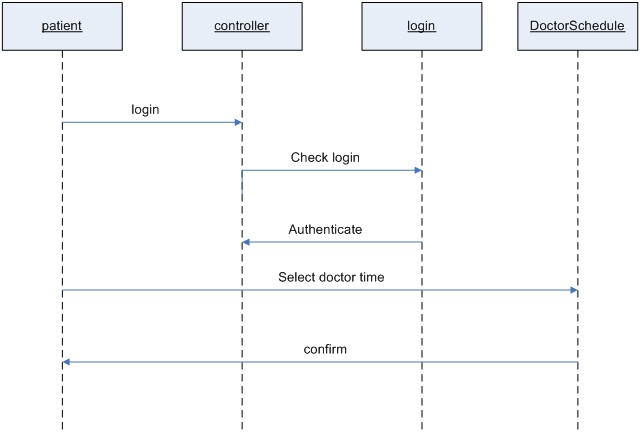
Sequence Diagram
A sequence diagram represents the interaction between different objects in the system. The important aspect of a sequence diagram is that it is time ordered which means that the exact sequence of the interactions between the objects is represented step by step as shown in figure 6.

Figure 5 Sequence- Diagram Schedule Appointment .
This sequence diagram represents the timing and flow of information within the “make appointment” use case. The summation of the appointment record is called the Doctors Schedule. The System Controller verifies that the appointment time is available notifies the patient, who confirms the appointment and the system updates the database.
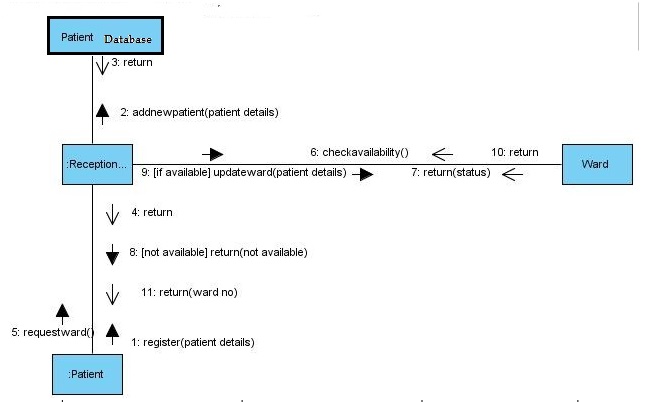
Collaboration Diagram
A collaboration diagram describes interactions among objects in terms of sequenced messages. Collaboration diagrams represent a combination of information taken from class, sequence, and use case diagrams describing both the static structure and dynamic behavior of a system.

Figure 6.
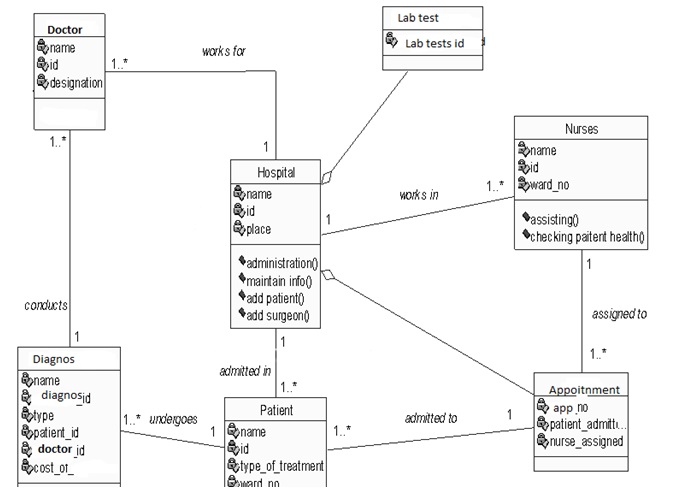
CLASS DIAGRAM
Classes represent an abstraction of entities with common characteristics. Associations represent the relationships between classes.

Figure 7.
STATE DIAGRAM
A statechart diagram shows the behavior of classes in response to external stimuli. This diagram models the dynamic flow of control from state to state within a system.
States represent situations during the life of an object. You can easily illustrate a state in SmartDraw by using a rectangle with rounded corners.

Figure 8.
Attachments (8)
- 1.jpg (44.5 KB ) - added by 11 years ago.
- 2.jpg (32.0 KB ) - added by 11 years ago.
- 3.jpg (52.0 KB ) - added by 11 years ago.
- 4.jpg (18.0 KB ) - added by 11 years ago.
- 5.jpg (30.5 KB ) - added by 11 years ago.
- 6.jpg (35.1 KB ) - added by 11 years ago.
- 7.jpg (60.9 KB ) - added by 11 years ago.
- 8.jpg (73.0 KB ) - added by 11 years ago.
Download all attachments as: .zip